
Scenario
Using public car crash data from the City of Detroit (2011-2024) and free coding resource libraries (Spark and SQL via Google Colab), I gleaned unique insights and trends.
No cleaning was done to this data, I simply approach it as-is (although I do note when some odd things come up)
Click the “Scenario” link for the entire live Colab sheet.
Descriptive Statistics
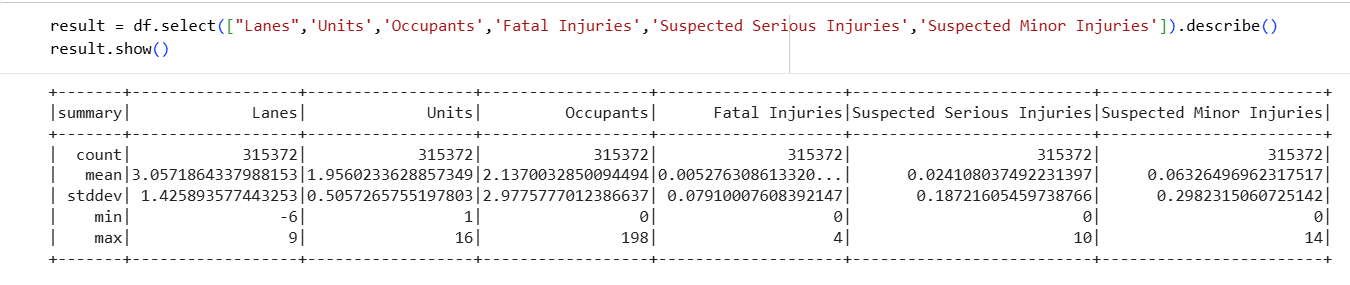
Insights:
From the above we can see that the average number of lanes involved in an accident is 3, which describes a standard interstate highway.
However, we can also see a minimum value of "-6", which is an error. If we wanted to do more analysis with the num_lanes data, we would probably want to drop any rows showing 0 or fewer lanes.
The average number of units involved is about 2, which we makes sense! Lots of accidents involving just 1 vehicle, and the maximum is a shocking 16.
Again, the average occupants is 2, which makes sense if 1 person is in each of the average 2 cars. While not impossible, the minimum of 0 is hard to understand, and the maximum of 198 also seems unlikely. Perhaps it was a coach bus.
We can also see the spread here of fatal injuries, serious injuries, and minor injuries involved in crashes. Far more than 99% of all recorded crashes have fewer than 1 fatality or even a recorded injury