Concept
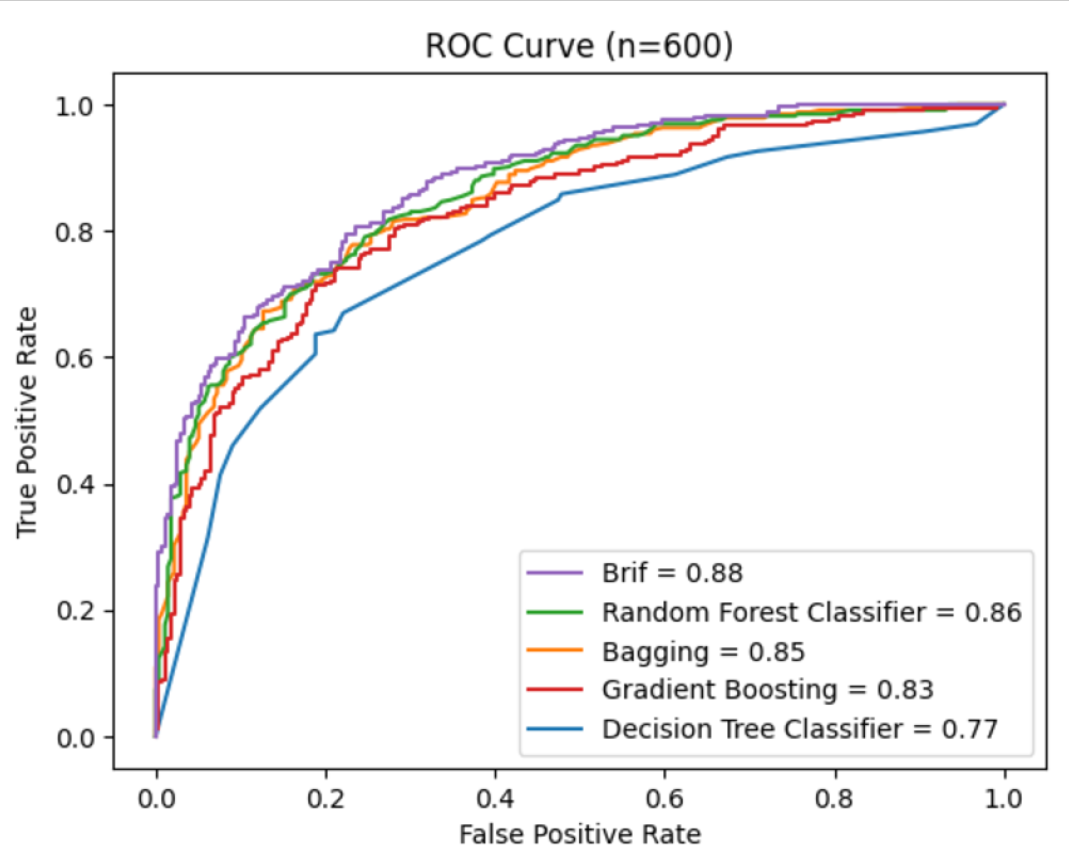
This was from a homework problem during one of my Masters program classes. I was tasked with taking a publicly available data set, cleaning it, and using train_test_split() in python to create several tree-based predictor models. Finally, we built a visualization comparing the models’ ROC curves to see which model performed the best.
Most interestingly, in addition to using established models like Random Forest, I was instructed to use a model that the professor himself had developed (called “brif”).
Process
Cleaning the data involved re-coding the “wine quality” variable into a binary (i.e., quality of 6 or higher was coded as “1”)
I then ran train_test_split() using a random state and a test size of 600. I ran the following models:
DecisionTreeClassifier from sklearn
RandomForestClassifier from sklearn with max_features = p
RandomForestClassifier from sklearn with max_features = sqrt(p)
GradientBoostingClassifier from sklearn
brif with ntrees=200
Visualization